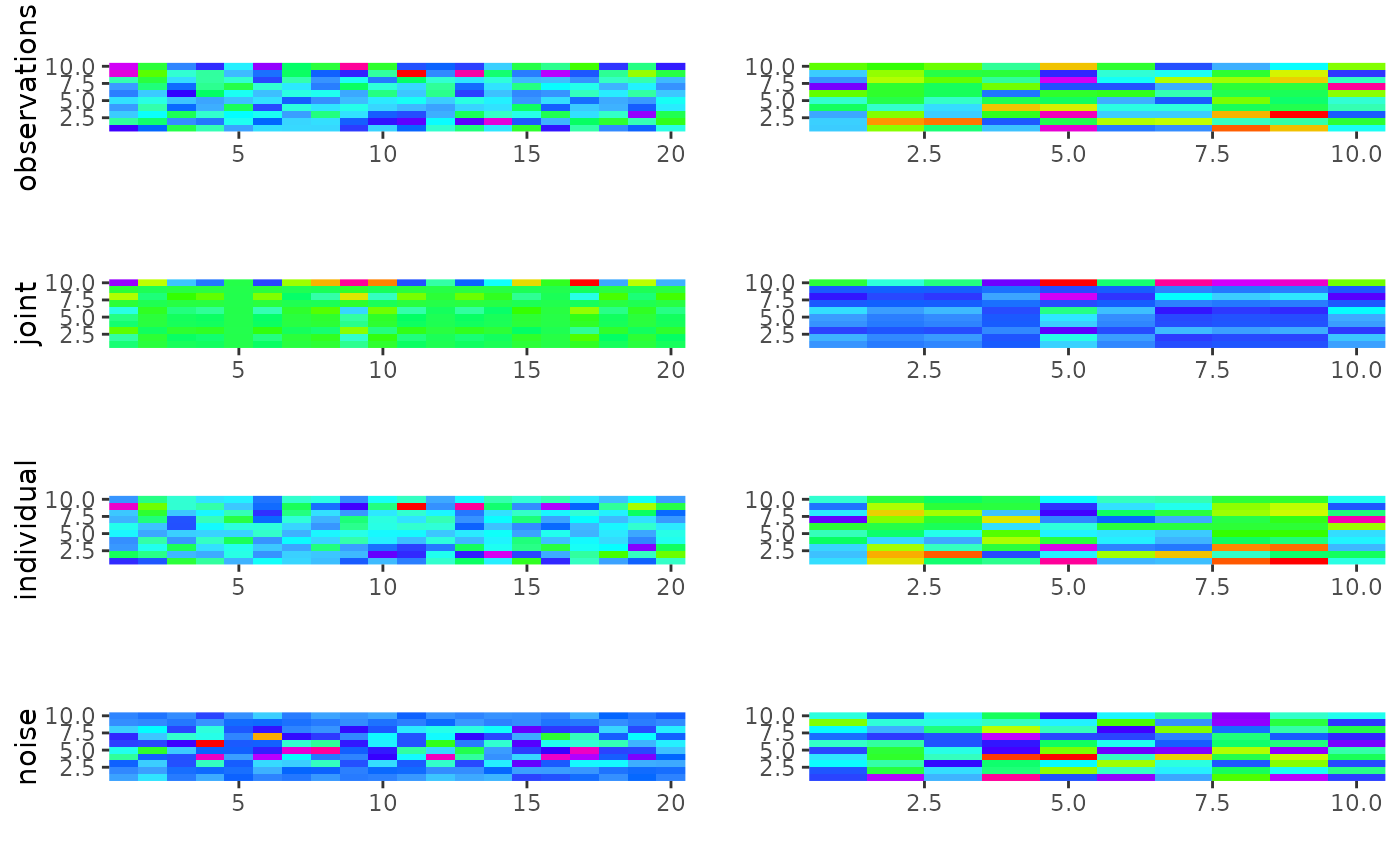
Visualization of the RaJIVE decomposition, it shows heatmaps of the decomposition obtained by RaJIVE
Examples
# \donttest{
n <- 10
pks <- c(20, 10)
Y <- ajive.data.sim(K =2, rankJ = 2, rankA = c(7, 4), n = n,
                 pks = pks, dist.type = 1)
initial_signal_ranks <-  c(7, 4)
data.ajive <- list((Y$sim_data[[1]]), (Y$sim_data[[2]]))
ajive.results.robust <- Rajive(data.ajive, initial_signal_ranks)
#> [1] "removing column 0"
#> [1] "removing column 0"
decomposition_heatmaps_robustH(data.ajive, ajive.results.robust)
#> Warning: `aes_string()` was deprecated in ggplot2 3.0.0.
#> ℹ Please use tidy evaluation idioms with `aes()`.
#> ℹ See also `vignette("ggplot2-in-packages")` for more information.
#> ℹ The deprecated feature was likely used in the rajiveutils package.
#>   Please report the issue at
#>   <https://github.com/mdmanurung/RaJIVEutils/issues>.

# }
# }