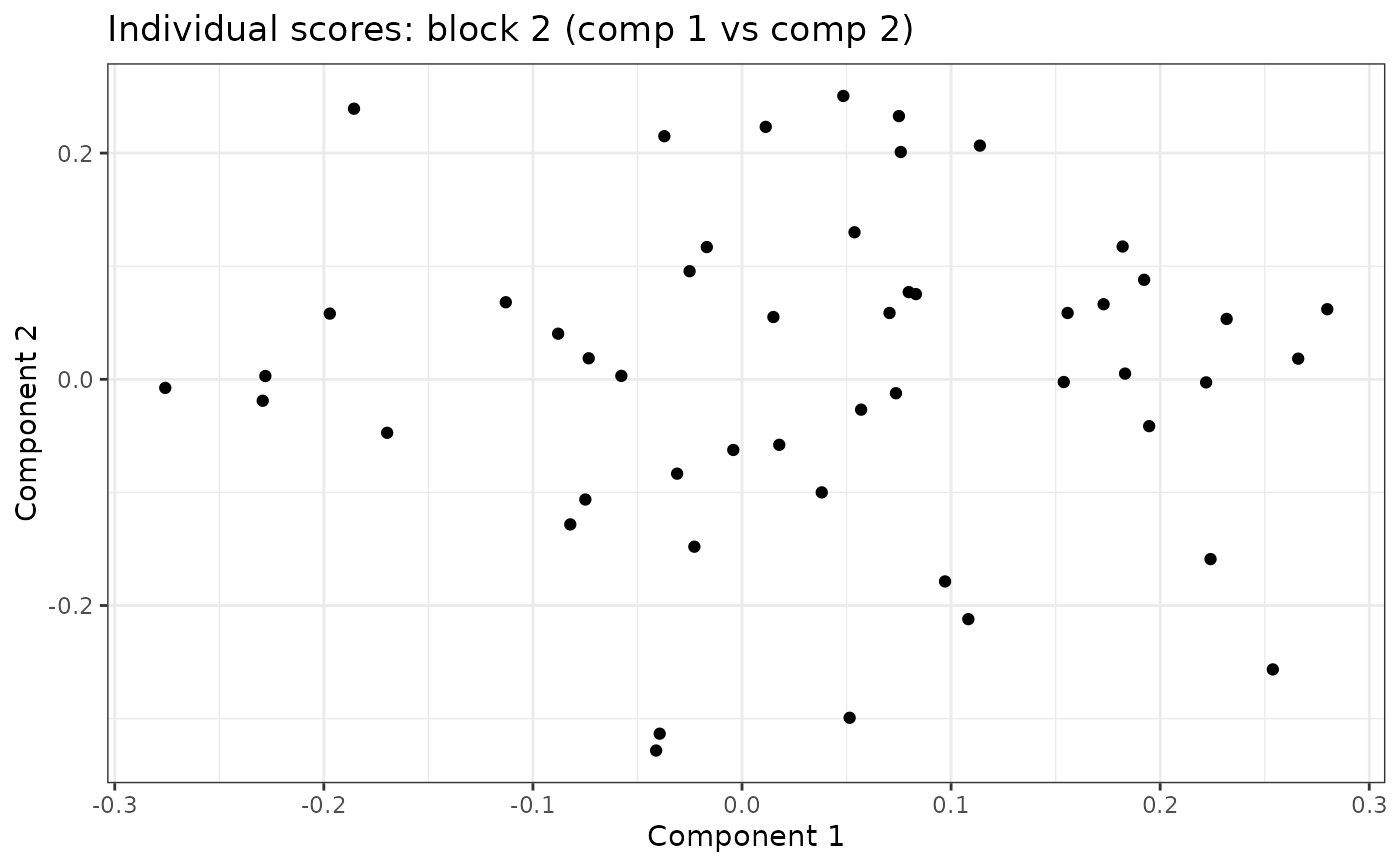
Plots two score components against each other for a given data block and component type (joint or individual), making it easy to visualise the latent structure captured by the RaJIVE decomposition.
Usage
plot_scores(
  ajive_output,
  k,
  type = c("joint", "individual"),
  comp_x = 1L,
  comp_y = 2L,
  group = NULL
)
Arguments
- ajive_output
List returned by
Rajive.- k
Positive integer; index of the data block.
- type
Character string;
"joint"or"individual".- comp_x
Positive integer; index of the component to plot on the x-axis. Default
1.- comp_y
Positive integer; index of the component to plot on the y-axis. Default
2.- group
Optional factor or vector (length equal to the number of observations) used to colour the points.
NULL(default) gives uniform colouring.
Examples
# \donttest{
n <- 50; pks <- c(60, 40)
Y <- ajive.data.sim(K = 2, rankJ = 3, rankA = c(5, 4), n = n,
                    pks = pks, dist.type = 1)
res <- Rajive(Y$sim_data, c(5, 4))
plot_scores(res, k = 1, type = "joint")
#> Error: 'comp_x' and 'comp_y' must each be <= 1 (the number of joint components for block 1).
plot_scores(res, k = 2, type = "individual", comp_x = 1, comp_y = 2)

# }
# }