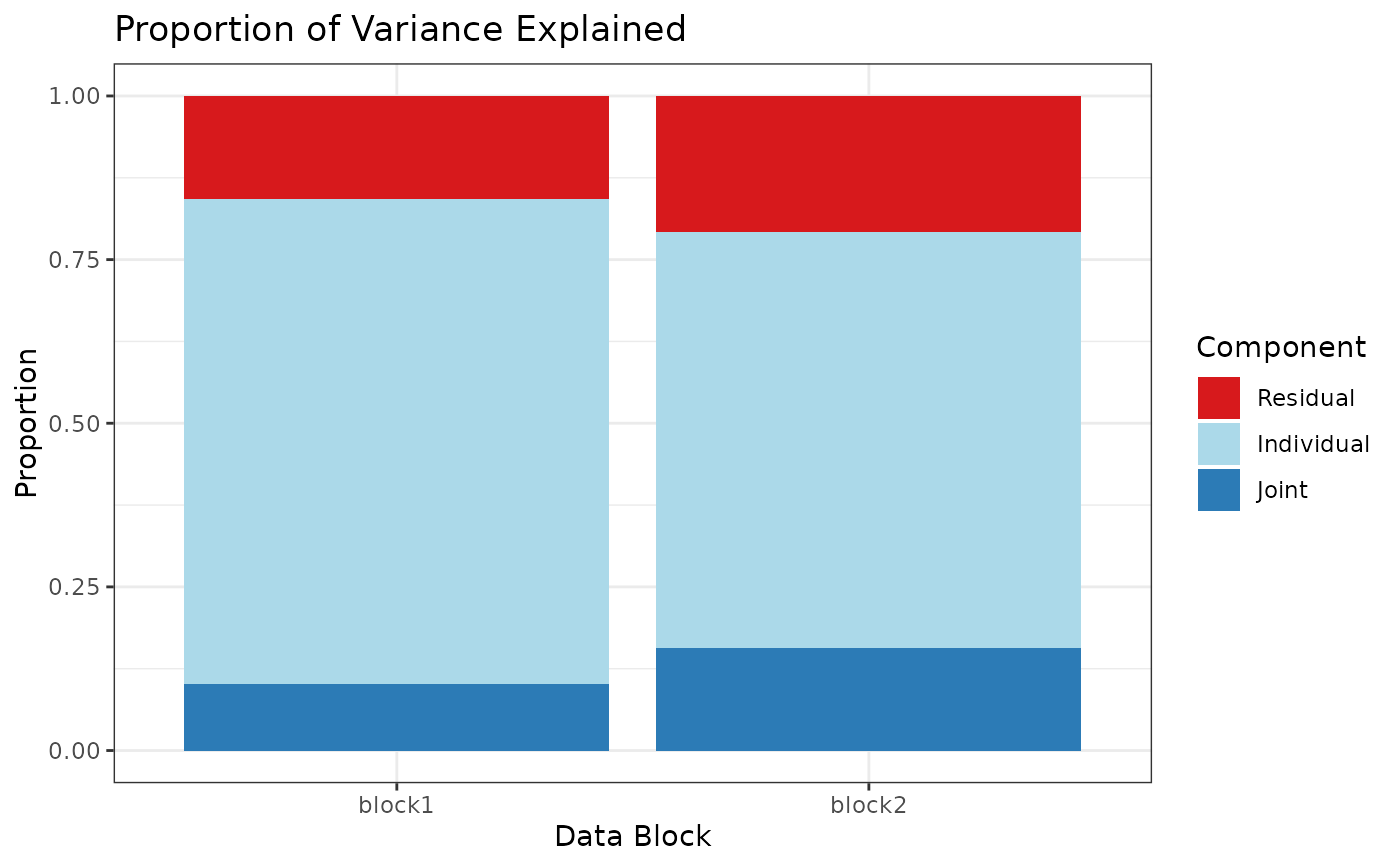
Produces a stacked bar chart showing the proportion of total variance explained by the joint, individual, and residual components for each data block.
Examples
# \donttest{
n <- 30; pks <- c(40, 30)
Y <- ajive.data.sim(K = 2, rankJ = 2, rankA = c(5, 4), n = n,
                    pks = pks, dist.type = 1)
data.ajive <- Y$sim_data
res <- Rajive(data.ajive, c(5, 4))
#> [1] "removing column 0"
#> [1] "removing column 0"
plot_variance_explained(res, data.ajive)

# }
# }