Figures
The figure-style skill gives every scientific figure one look, in R (ggplot2, ComplexHeatmap) and in Python (plotnine with plotnine-extra). It applies to plot types it has never seen, because it states principles first and forms second. It takes precedence over generic charting skills for figures drawn from experimental, omics or single-cell data.
Principles
- Name it, then explain it below. One short title; no subtitle; the caption goes in the report, at most 60 words.
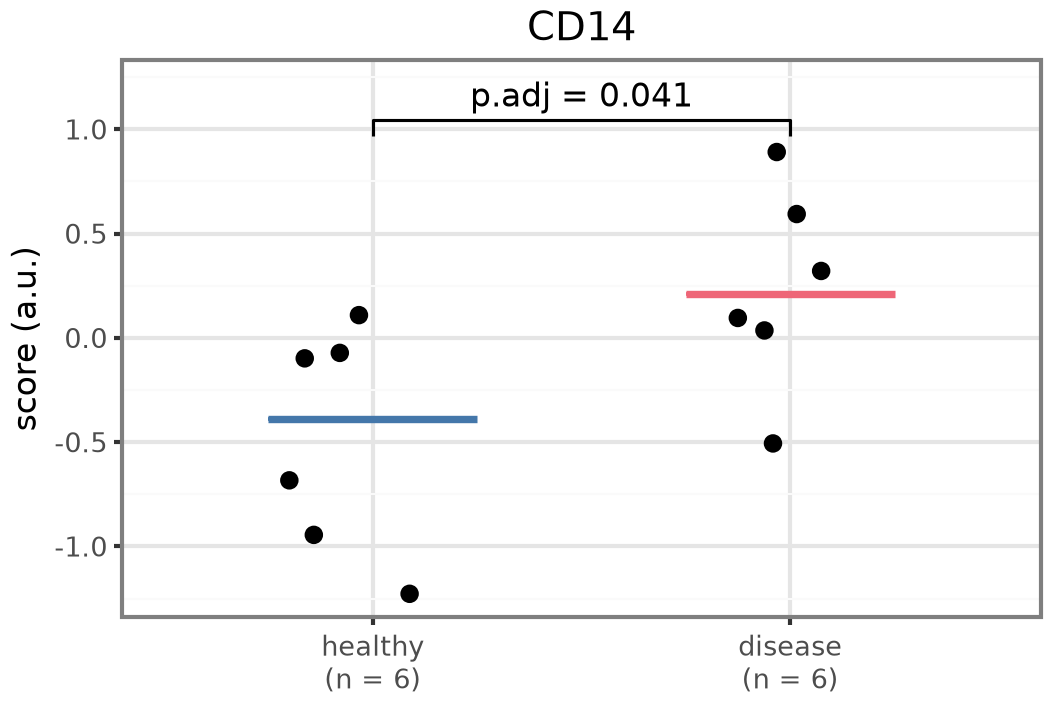
- Show the unit of replication. Each donor is a point; n sits under each group label.
- Make inference visible and honest. Brackets show the adjusted p; the test and adjustment come from the analysis plan.
- Colour has one job, and every scale is colour-blind safe. Label-keyed palettes from
categorical_palette()(Tol, Okabe-Ito, Tableau Color Blind; Tol discrete rainbow up to 23), viridis for continuous values, blue-white-red centred at 0, blue down and red up. - Encode groups twice. Colour plus shape or position, so the figure survives greyscale.
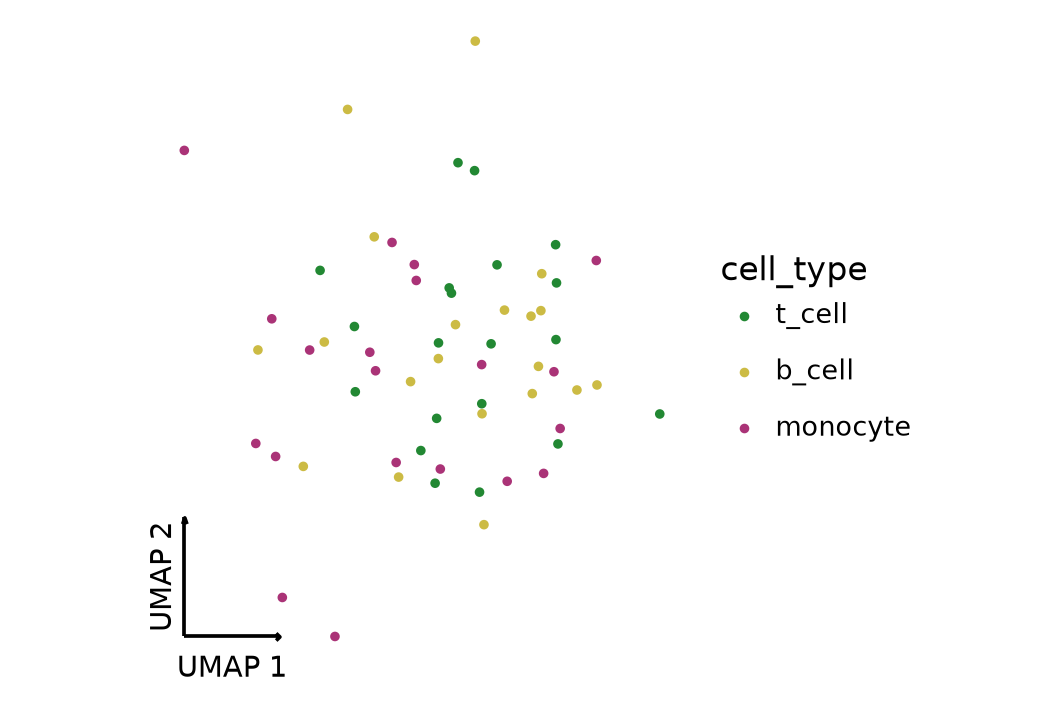
- Axes carry meaning; labels read at print size. Units on every axis; log₂ typeset; text at least 6 pt, black or white on fills by contrast, no overlapping labels; embeddings without frame, with corner arrows.
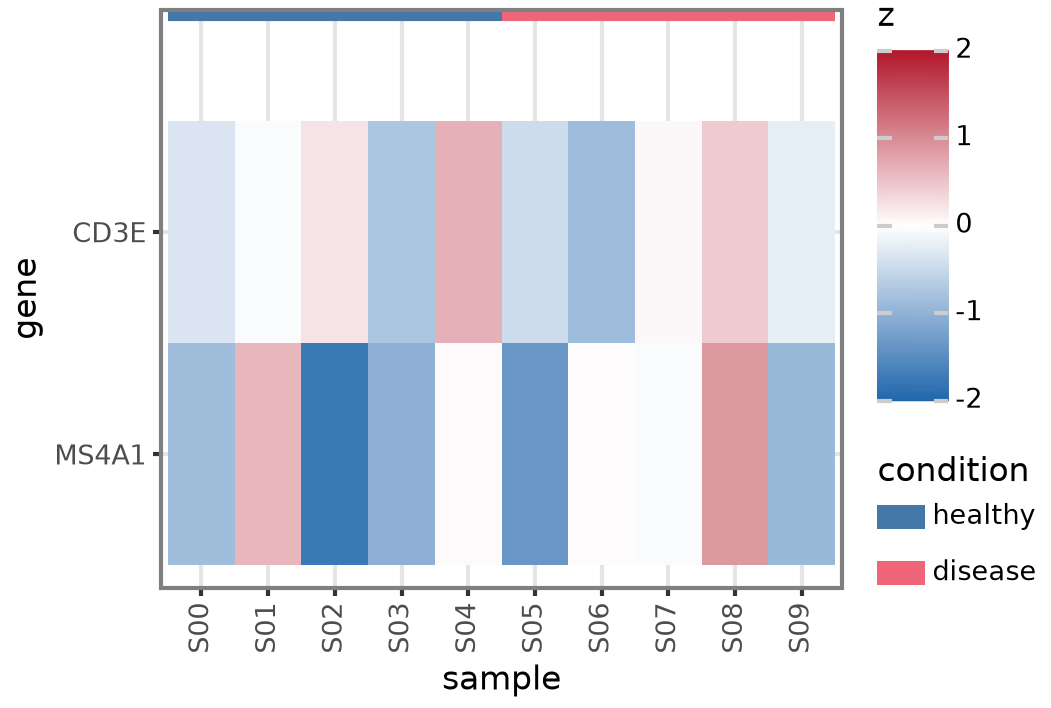
- Order is information. Natural orders stay; a heatmap states its order basis.
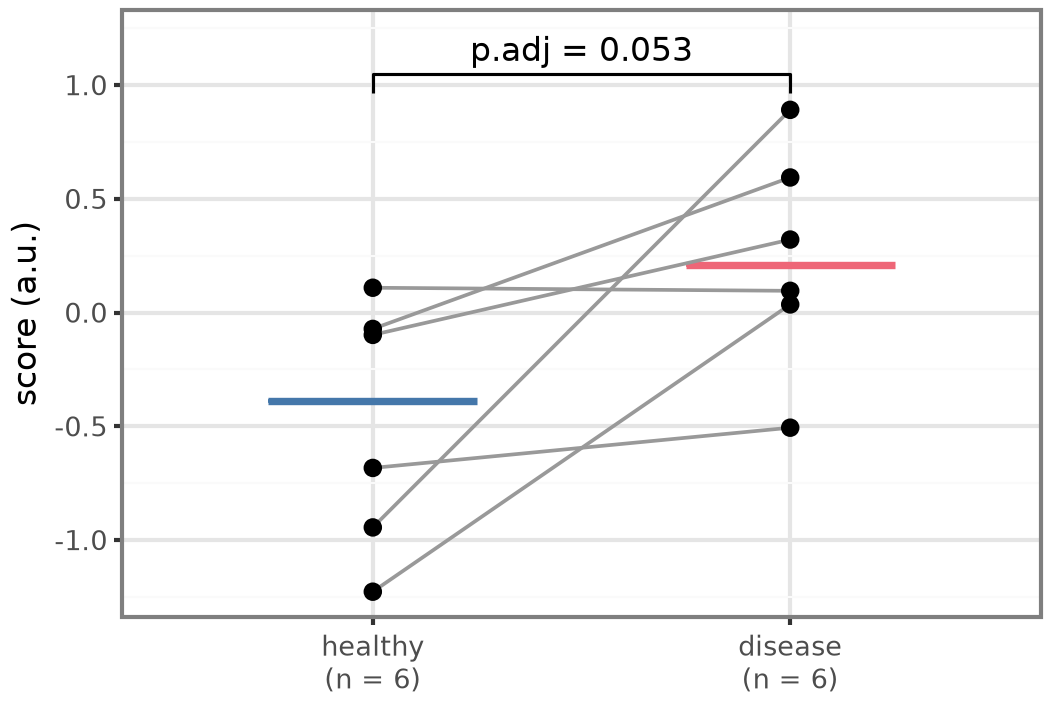
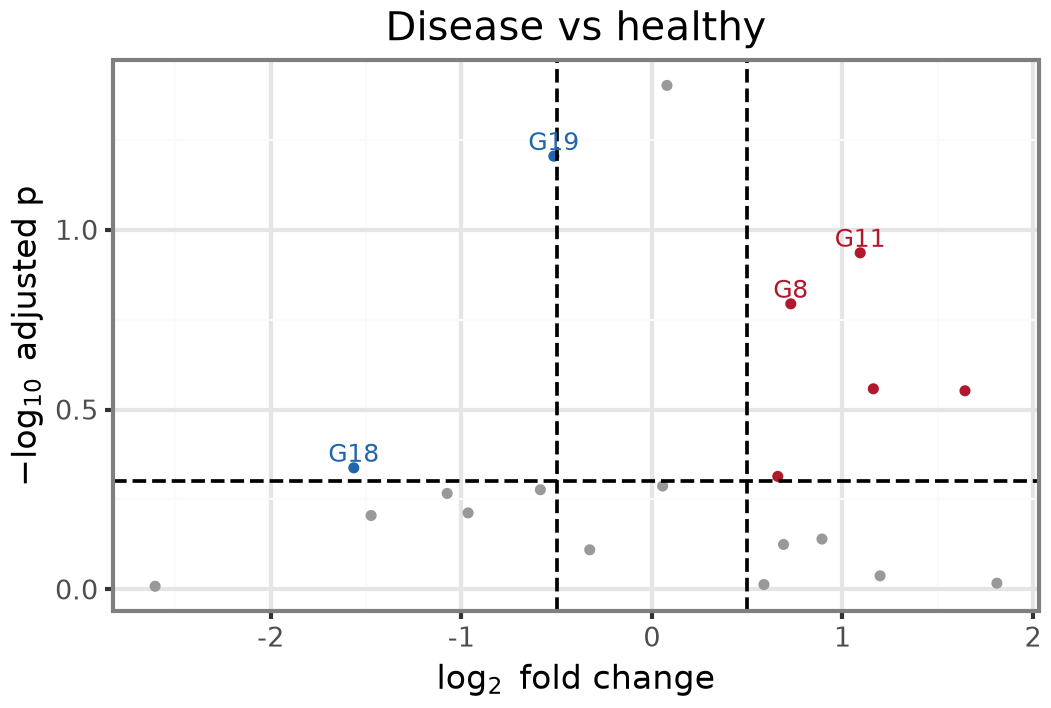
- Mark the design. Dashed thresholds; pair lines only for paired data; annotation bars on heatmaps.
- Show every point. Jittered points with a median crossbar under 10 per group, a box from 10; no violin in results figures (QC review plots may use one). Pie, radial and dual-axis charts are not used.
- Missing is not zero. “Not tested” gets its own mark.
- One build, three files.
cairo_pdf, a PNG for review, and the source-data CSV.
The full text, with worked examples for Kaplan–Meier, correlation matrices, ridgelines, spatial maps and GSEA curves, is in skills/figure-style/SKILL.md.
Gallery
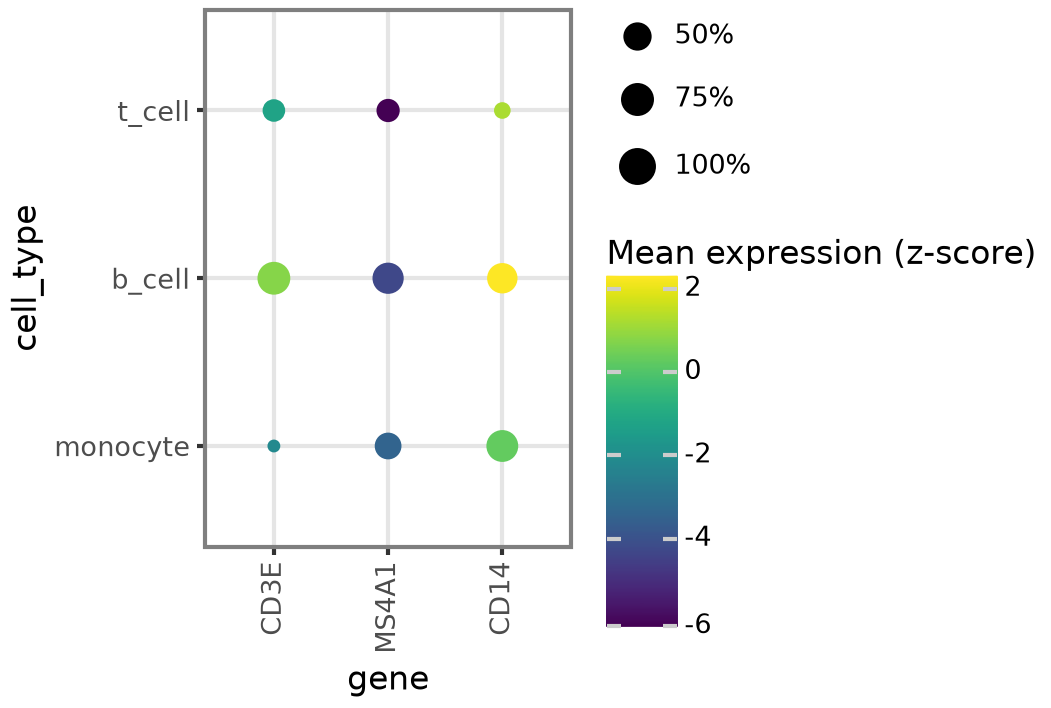
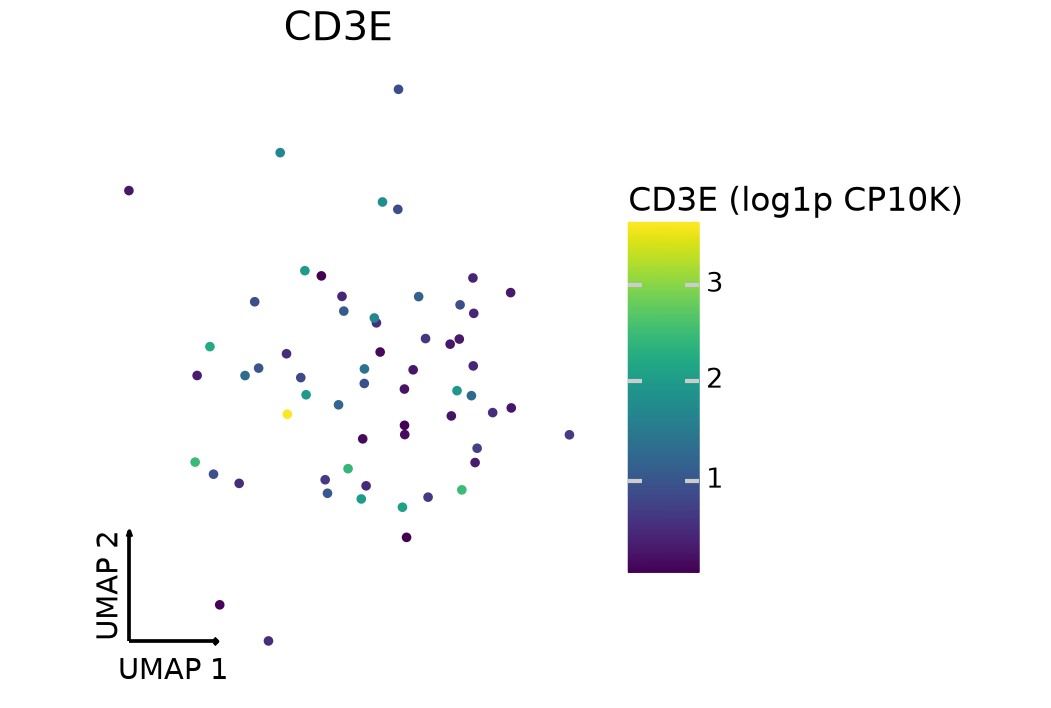
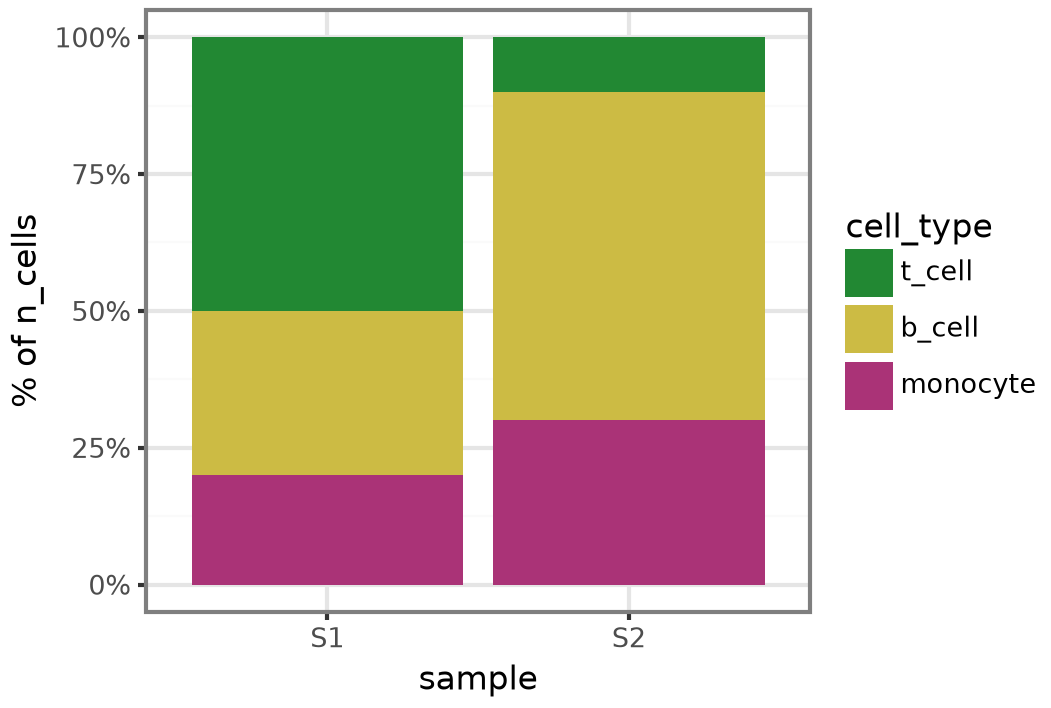
These come from the Python templates’ self-check on toy data. The R templates draw the same forms.
Templates
Copy templates/theme.*, palettes.* and plots.* into a project and source or import them. Every function returns a ggplot object, in either language.
| Function | Form |
|---|---|
plot_box(..., test=, p_adjust=, pair=) |
Points per group with brackets; paired with pair= |
plot_volcano(..., n_label=) |
Volcano with dashed cut-offs |
plot_heatmap(..., col_annotation=) |
Diverging heatmap with symmetric limits |
plot_dotplot(..., mean_label=) |
Marker dot plot |
plot_embedding(..., axis_name=) |
UMAP or PCA by label |
plot_feature |
One value on an embedding |
plot_composition |
Stacked proportions per sample |
plot_scatter_fit |
Scatter with a fitted line |
save_panel(plot, data, run_dir, name, width_mm, height_mm) |
Writes PDF, PNG and CSV |
from palettes import pal_condition
from plots import plot_box
from theme import save_panel

p = plot_box(
    donors, "condition", "score", pal_condition,
    jitter_width=0.2, seed=1, value_label="ISG score (a.u.)",
    test="wilcox.test", p_adjust="BH", title="ISG15 in CD14+ monocytes",
)
save_panel(p, donors, "results/run_01", "fig2c-isg-score", 89, 60)
The test and the adjustment have no default: pass both or neither.