StatCompare
Python port of the `StatCompare <https://github.com/HMU-WH/ggcompare/blob/main/vignettes/StatCompare.Rmd>`__ vignette from the R package ggcompare.
The stat_compare layer in plotnine_extra adds behavior not covered by `ggsignif::geom_signif() <https://github.com/const-ae/ggsignif>`__ or `ggpubr::stat_compare_means() <https://github.com/kassambara/ggpubr>`__:
Per-panel detection of x positions that contain data.
Layer-level p-value adjustment across panels, with
panel_indep=Truefor panel-only adjustment.Explicit handling of panels where one comparison group is absent.
You usually do not need to specify a test method. Set parametric to choose the parametric or non-parametric family, and the layer selects the two-group or multi-group test:
number of groups |
parametric |
non-parametric |
|---|---|---|
2 |
Welch t-test |
Wilcoxon rank-sum test |
> 2 |
One-way ANOVA |
Kruskal-Wallis test |
[1]:
import warnings

warnings.filterwarnings("ignore")

import matplotlib

matplotlib.rcParams["figure.dpi"] = 110

from plotnine import (
    aes,
    after_stat,
    element_text,
    facet_grid,
    geom_boxplot,
    ggplot,
    theme,
    theme_bw,
)
from plotnine.data import mpg

import plotnine_extra
from plotnine_extra import stat_compare

print("plotnine_extra", plotnine_extra.__version__)
mpg.head()
plotnine_extra 0.3.1
[1]:
| manufacturer | model | displ | year | cyl | trans | drv | cty | hwy | fl | class | |
|---|---|---|---|---|---|---|---|---|---|---|---|
| 0 | audi | a4 | 1.8 | 1999 | 4 | auto(l5) | f | 18 | 29 | p | compact |
| 1 | audi | a4 | 1.8 | 1999 | 4 | manual(m5) | f | 21 | 29 | p | compact |
| 2 | audi | a4 | 2.0 | 2008 | 4 | manual(m6) | f | 20 | 31 | p | compact |
| 3 | audi | a4 | 2.0 | 2008 | 4 | auto(av) | f | 21 | 30 | p | compact |
| 4 | audi | a4 | 2.8 | 1999 | 6 | auto(l5) | f | 16 | 26 | p | compact |
Basic
[2]:
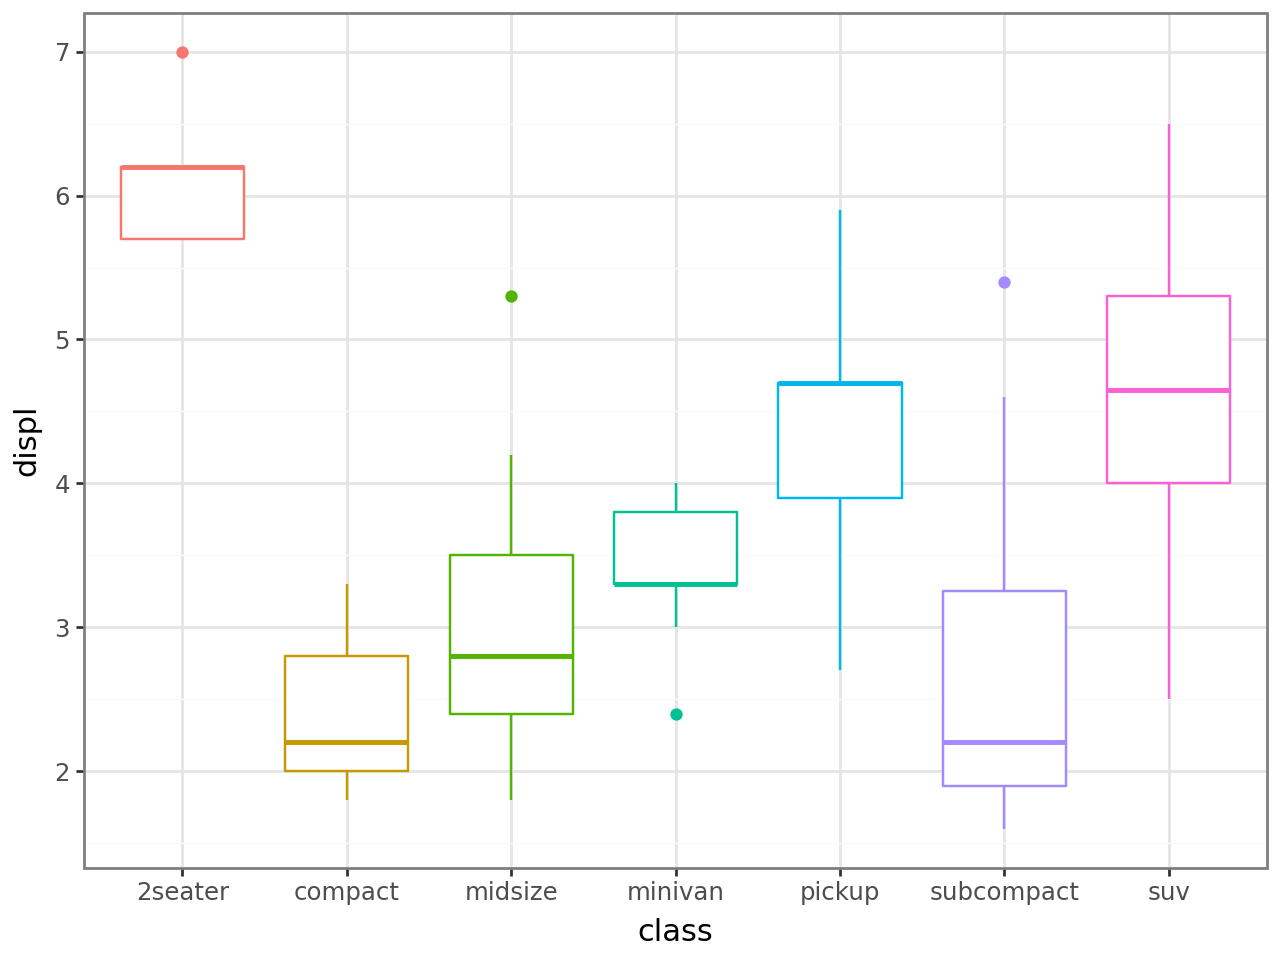
p = (
    ggplot(mpg, aes("class", "displ", color="class"))
    + geom_boxplot(show_legend=False)
    + theme_bw()
)
p
[2]:
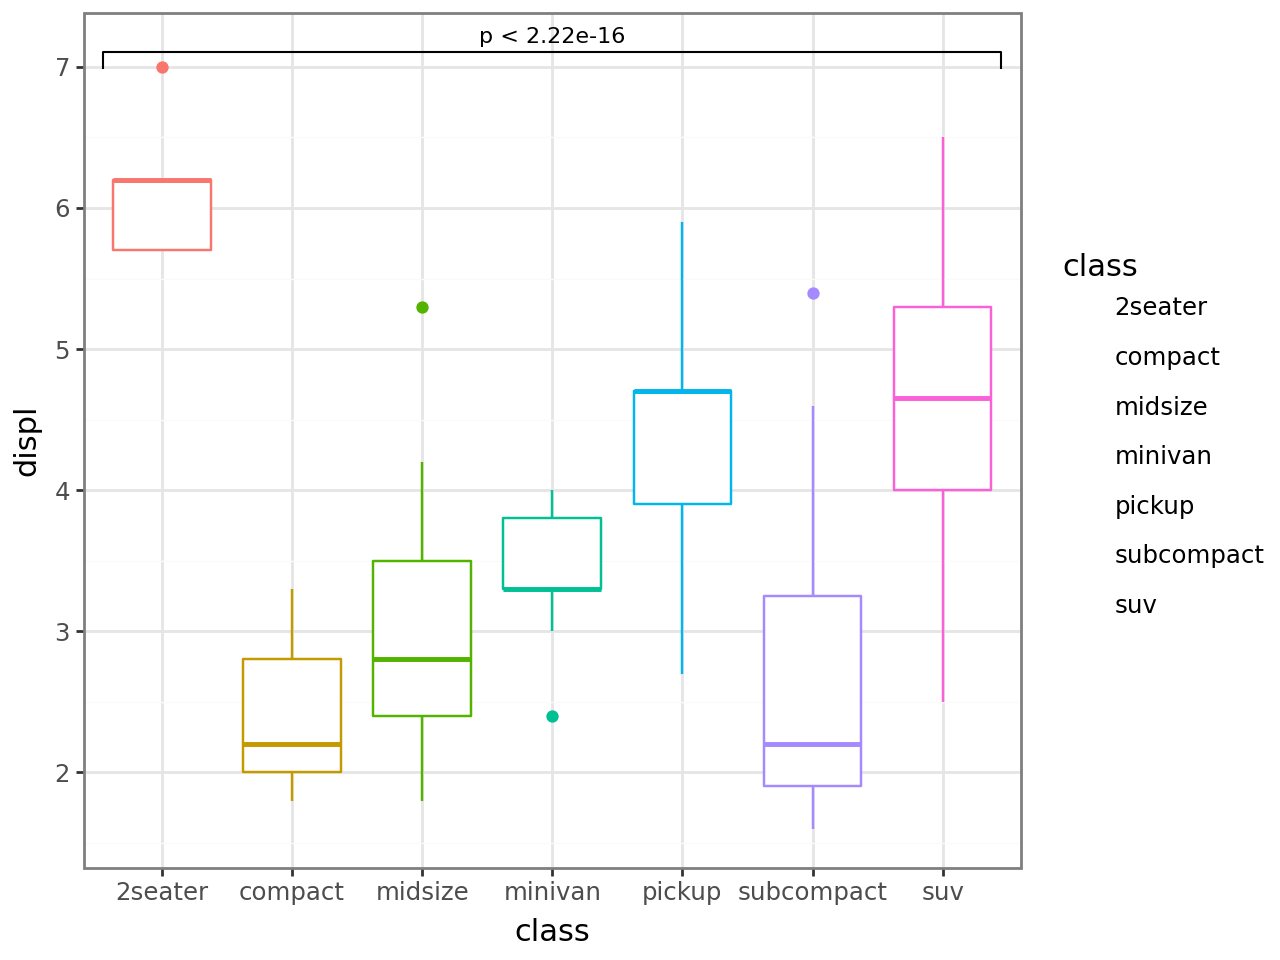
Global comparison: each x has only one group, so a single Kruskal-Wallis test is run across all classes.
[3]:
p + stat_compare()
[3]:
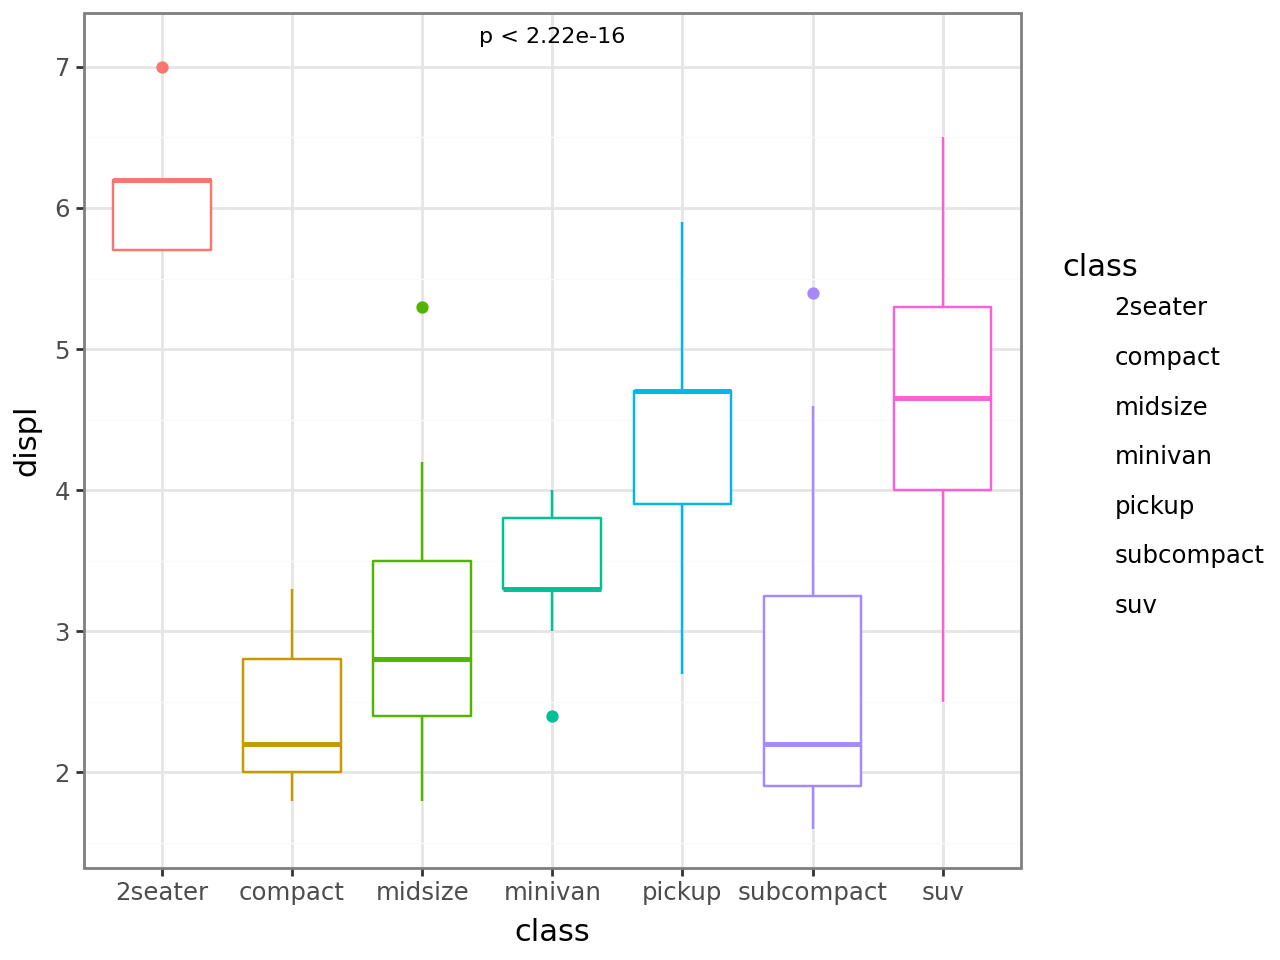
If you only want the p-value text without the bracket, set bracket=False.
[4]:
p + stat_compare(bracket=False)
[4]:
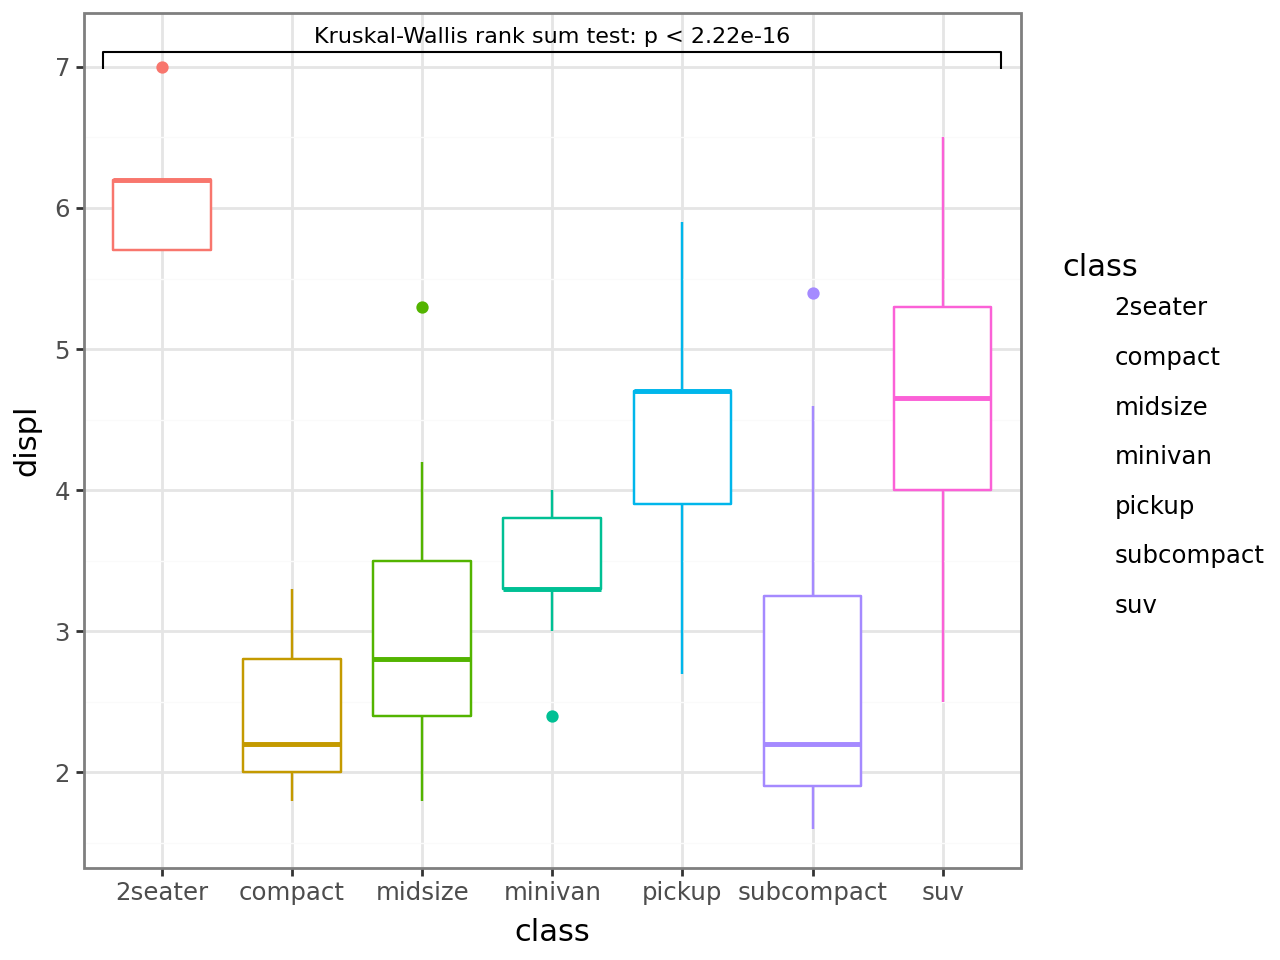
Display the test method by mapping label from the computed method and label aesthetics.
[5]:
p + stat_compare(
    aes(
        label=after_stat(
            'method.astype(str) + ": " + label.astype(str)'
        )
    )
)
[5]:
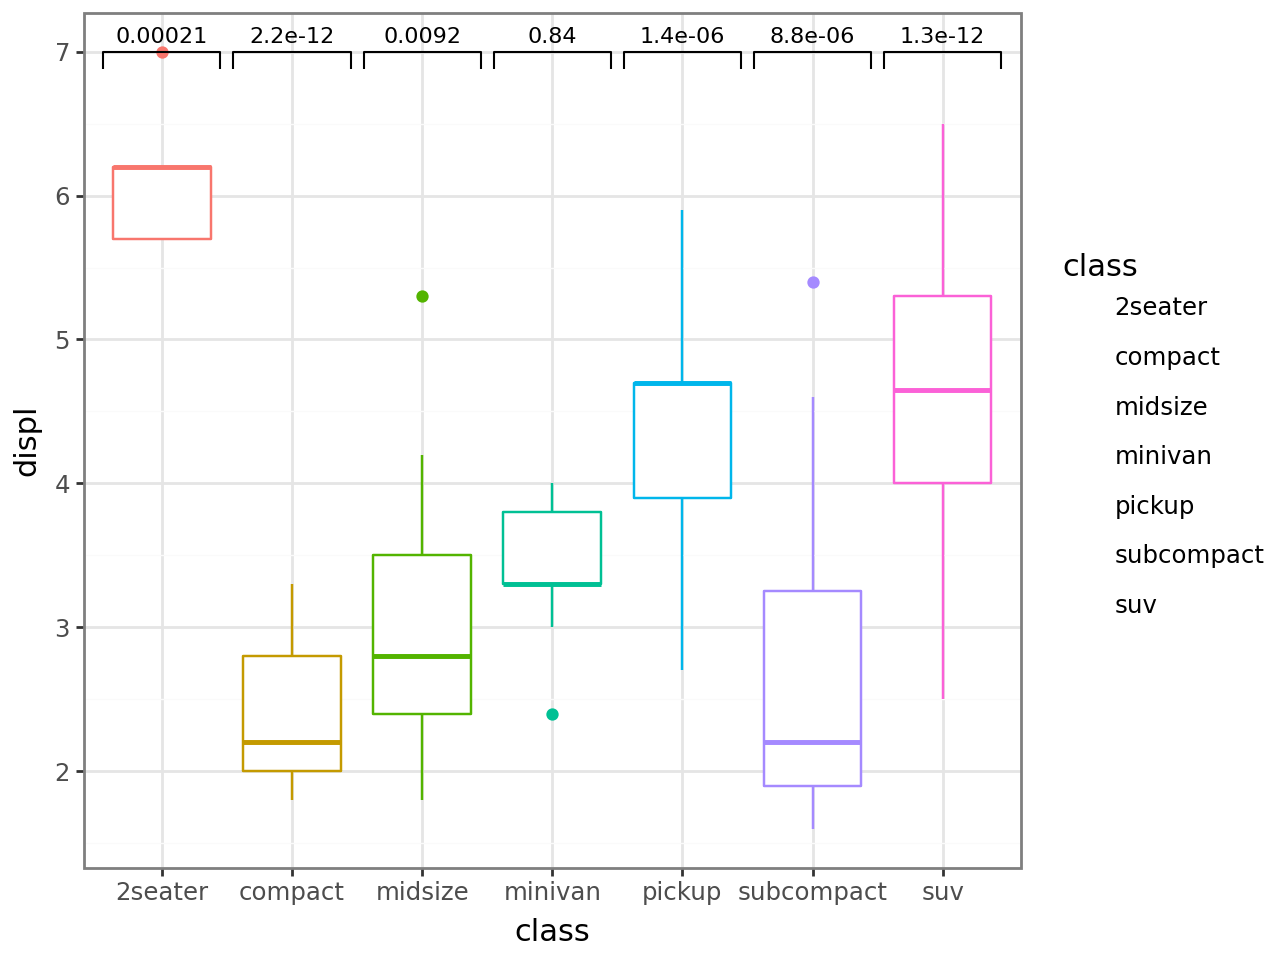
Each group vs. the rest: overall=True compares each x against the union of all other x-axis groups.
[6]:
p + stat_compare(overall=True)
[6]:
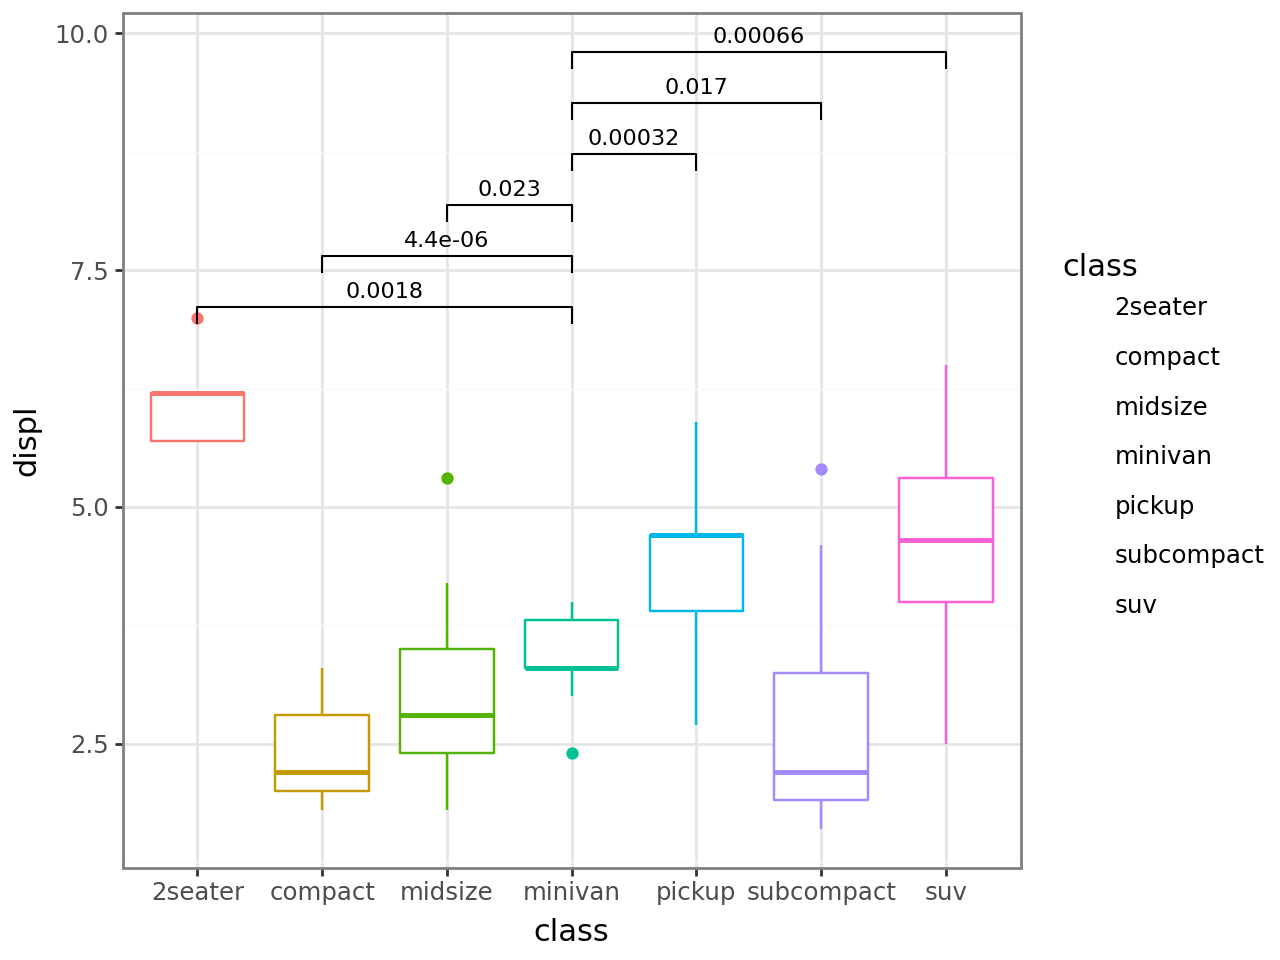
Reference group: every other x-axis level is compared against the reference level.
[7]:
p + stat_compare(ref_group="minivan")
[7]:
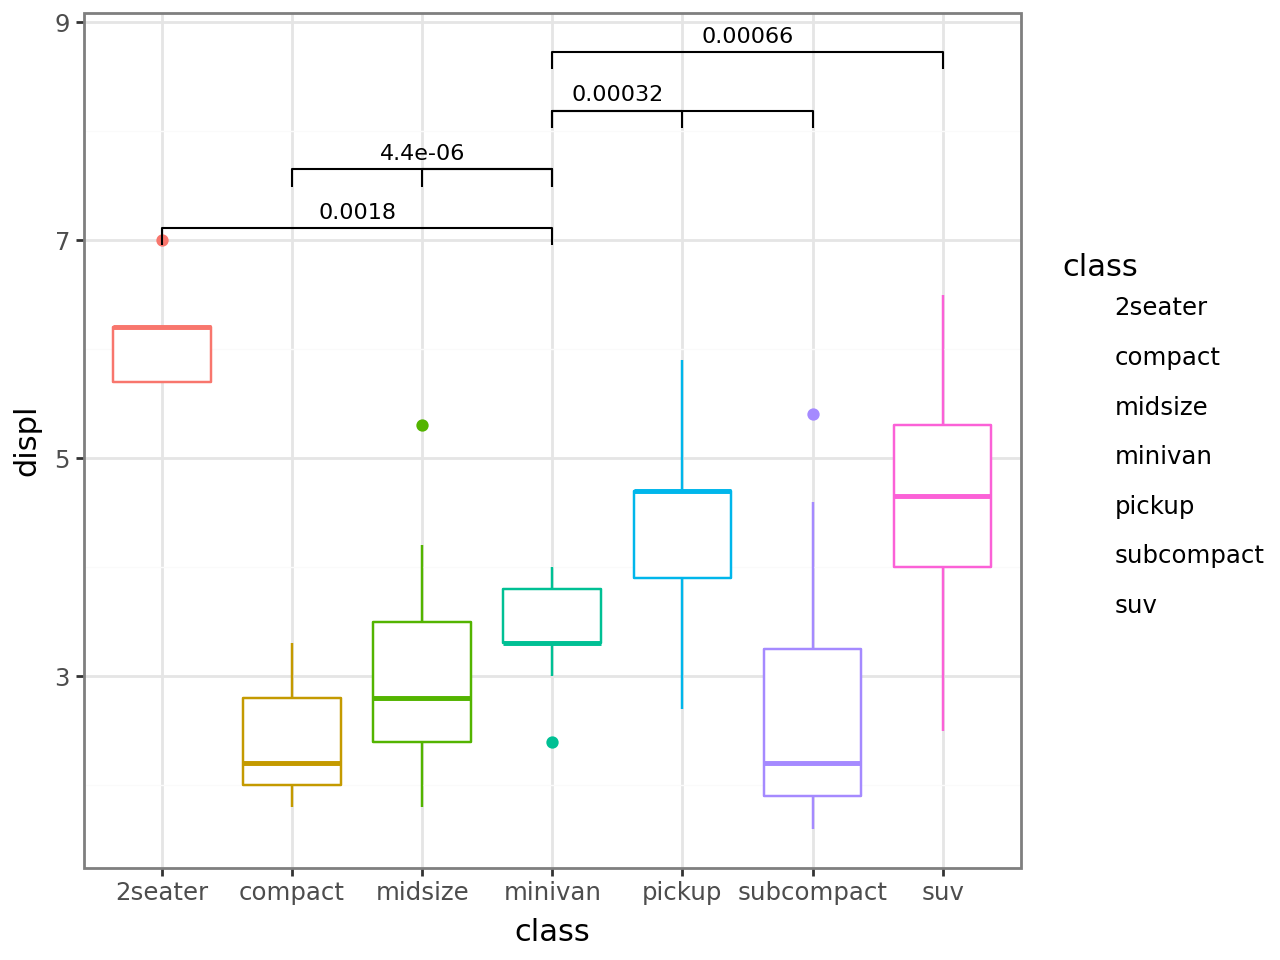
Hide labels for non-significant comparisons via cutoff.
[8]:
p + stat_compare(ref_group="minivan", cutoff=0.01)
[8]:
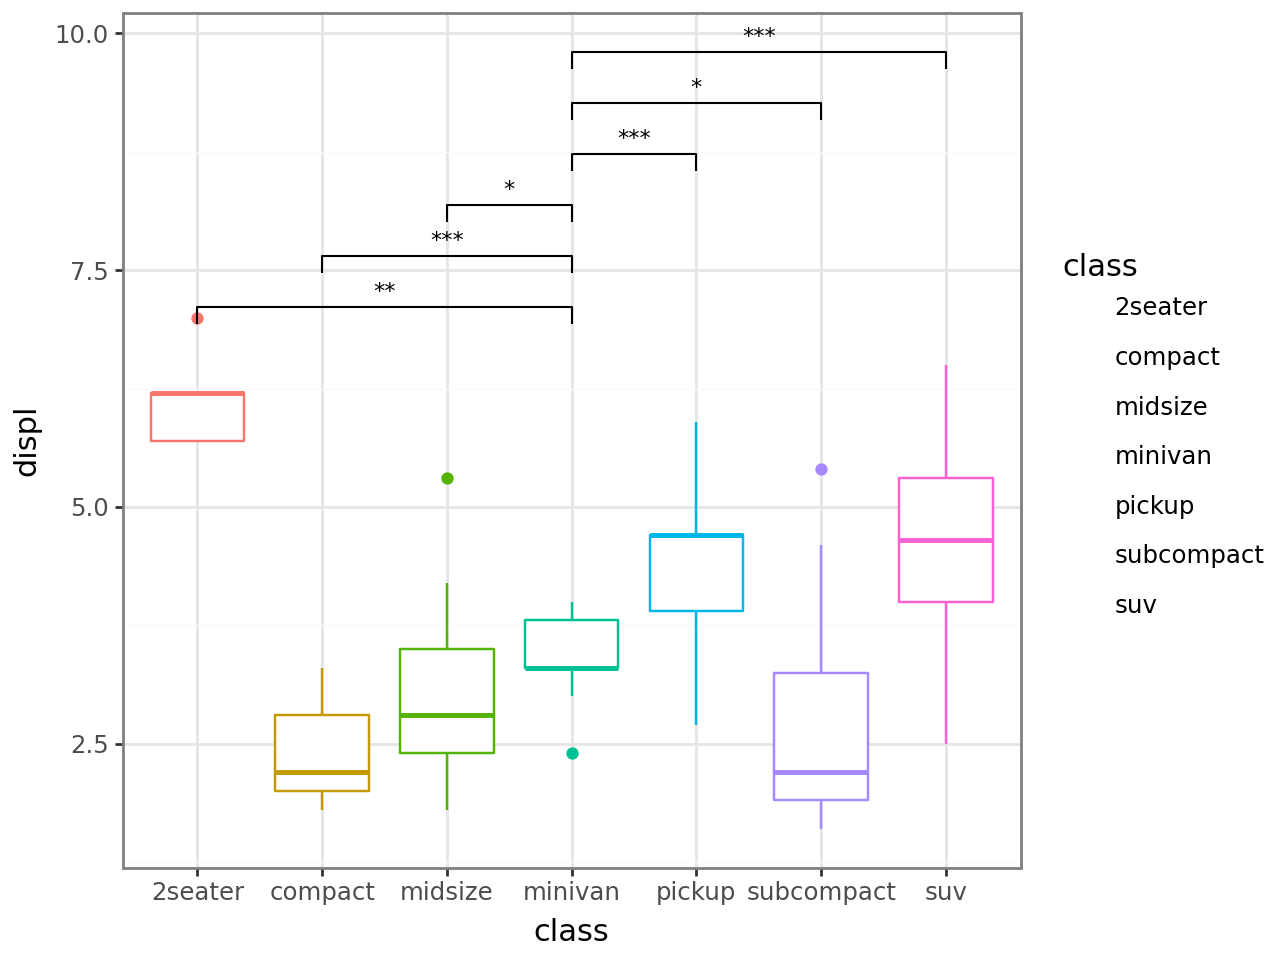
Display significance symbols by passing the breaks.
[9]:
p + stat_compare(
    ref_group="minivan",
    breaks=[0, 0.001, 0.01, 0.05, 1],
)
[9]:
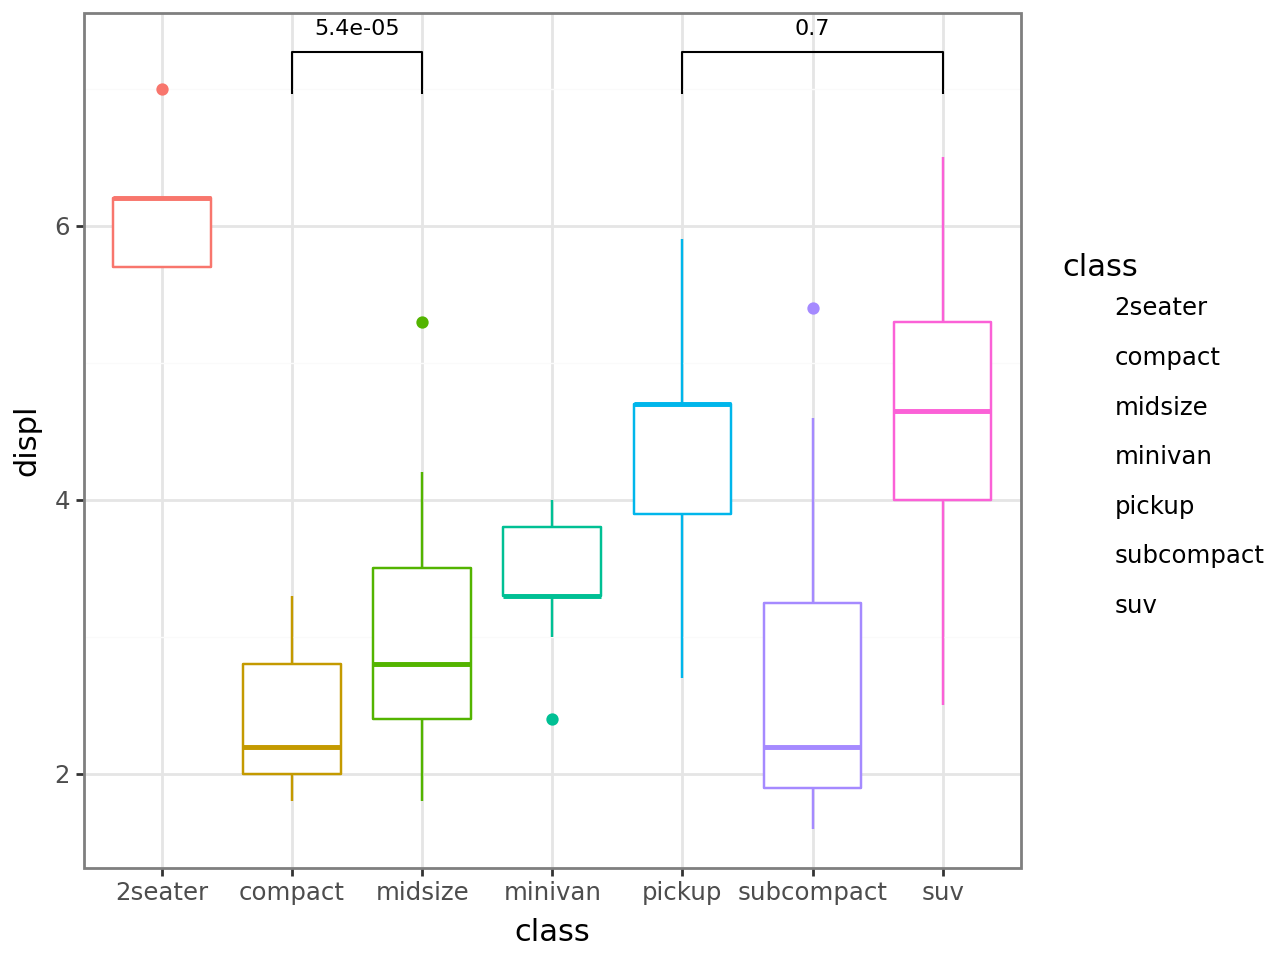
Explicit comparisons: pass a list of pairs.
[10]:
p + stat_compare(
    tip_length=0.05,
    step_increase=0,
    comparisons=[
        ("compact", "midsize"),
        ("pickup", "suv"),
    ],
)
[10]:
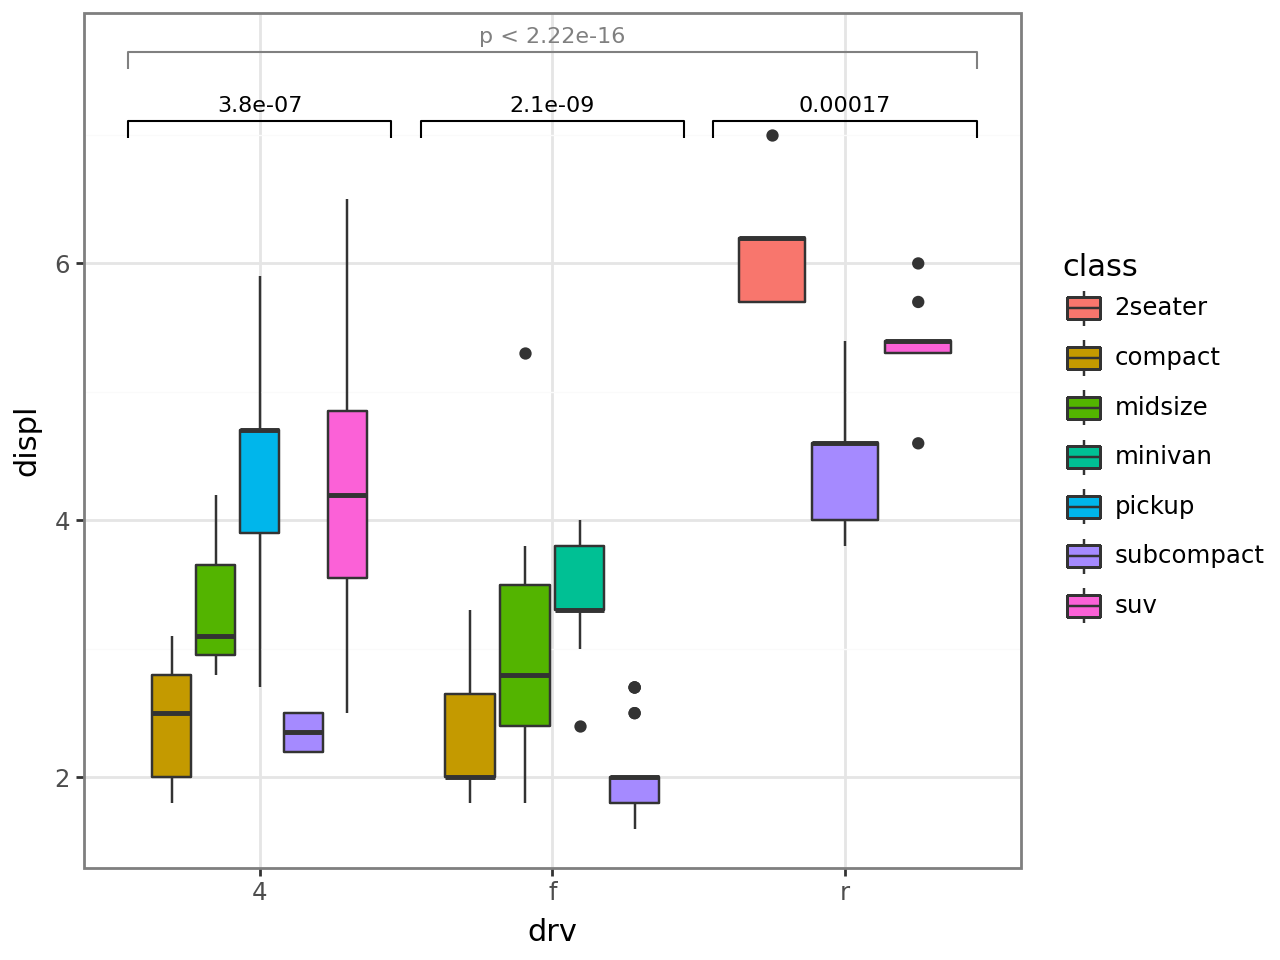
Within-x population comparison: when boxes are dodged within each x by another aesthetic, stat_compare automatically tests groups within each x. A second stat_compare(group=...) layer adds the global comparison on top.
[11]:
(
    ggplot(mpg, aes("drv", "displ", fill="class"))
    + geom_boxplot()
    + stat_compare()
    + stat_compare(aes(group="drv"), nudge=0.1, color="gray")
    + theme_bw()
)
[11]:
Enhancements
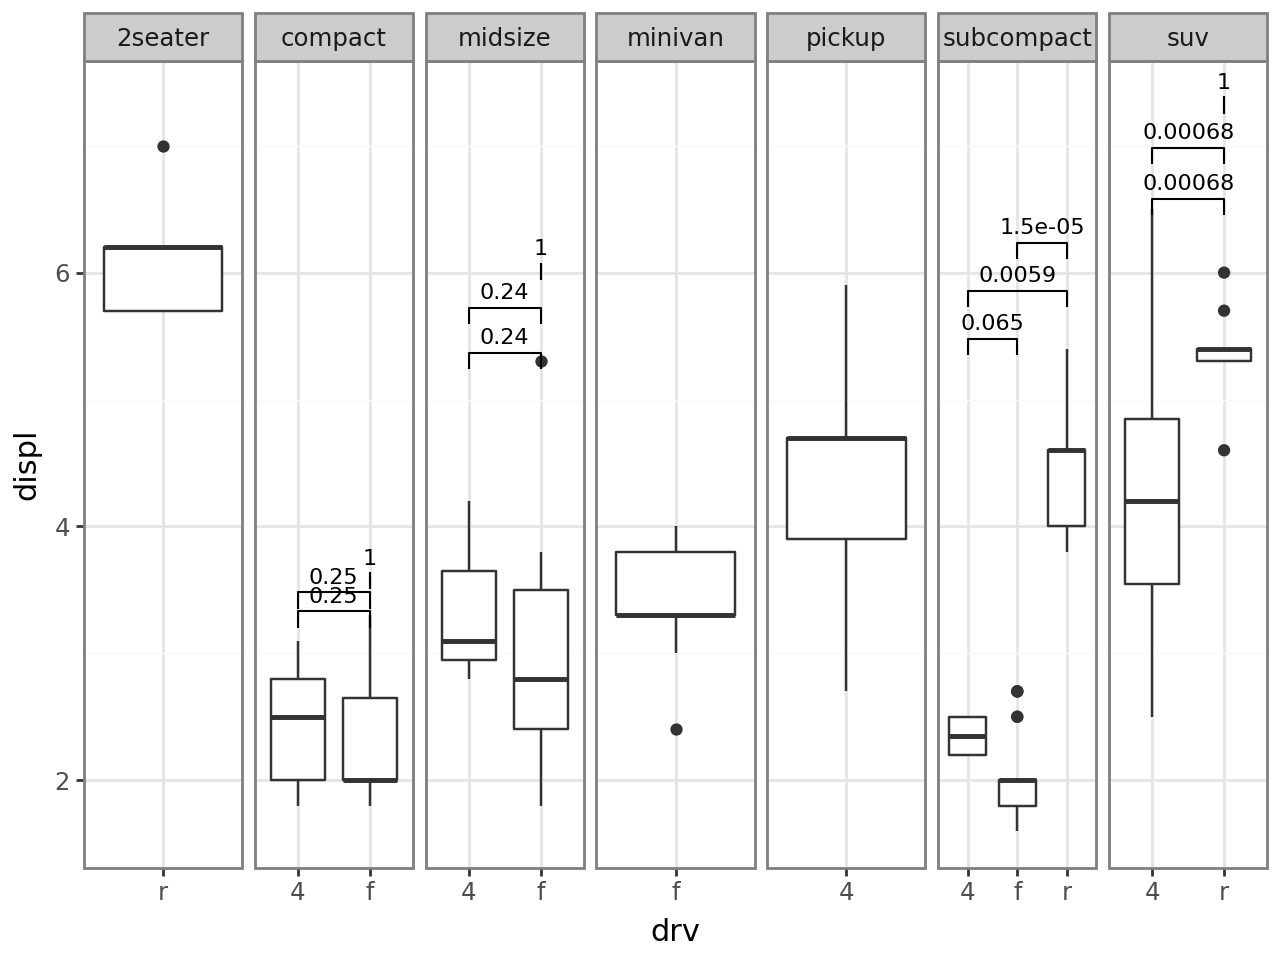
Faceting with missing groups
Pass an explicit comparison list and stat_compare applies it in each panel, skipping panel-level comparisons where one of the groups is absent.
[12]:
from itertools import combinations

drv_levels = sorted(mpg["drv"].unique())
pairs = list(combinations(drv_levels, 2))

(
    ggplot(mpg, aes("drv", "displ"))
    + geom_boxplot()
    + stat_compare(comparisons=pairs)
    + facet_grid(cols="class", scales="free")
    + theme_bw()
)
[12]:
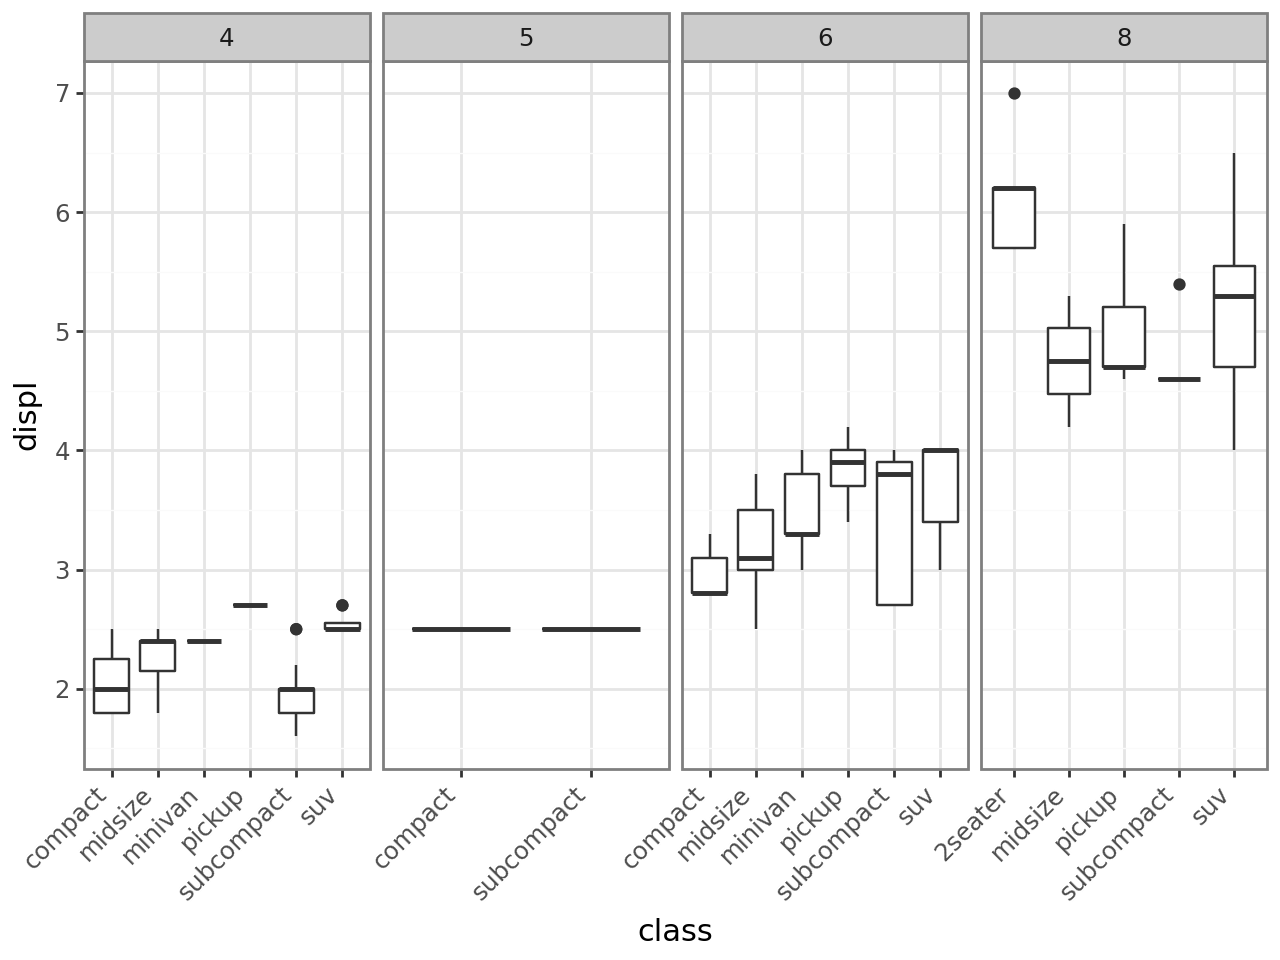
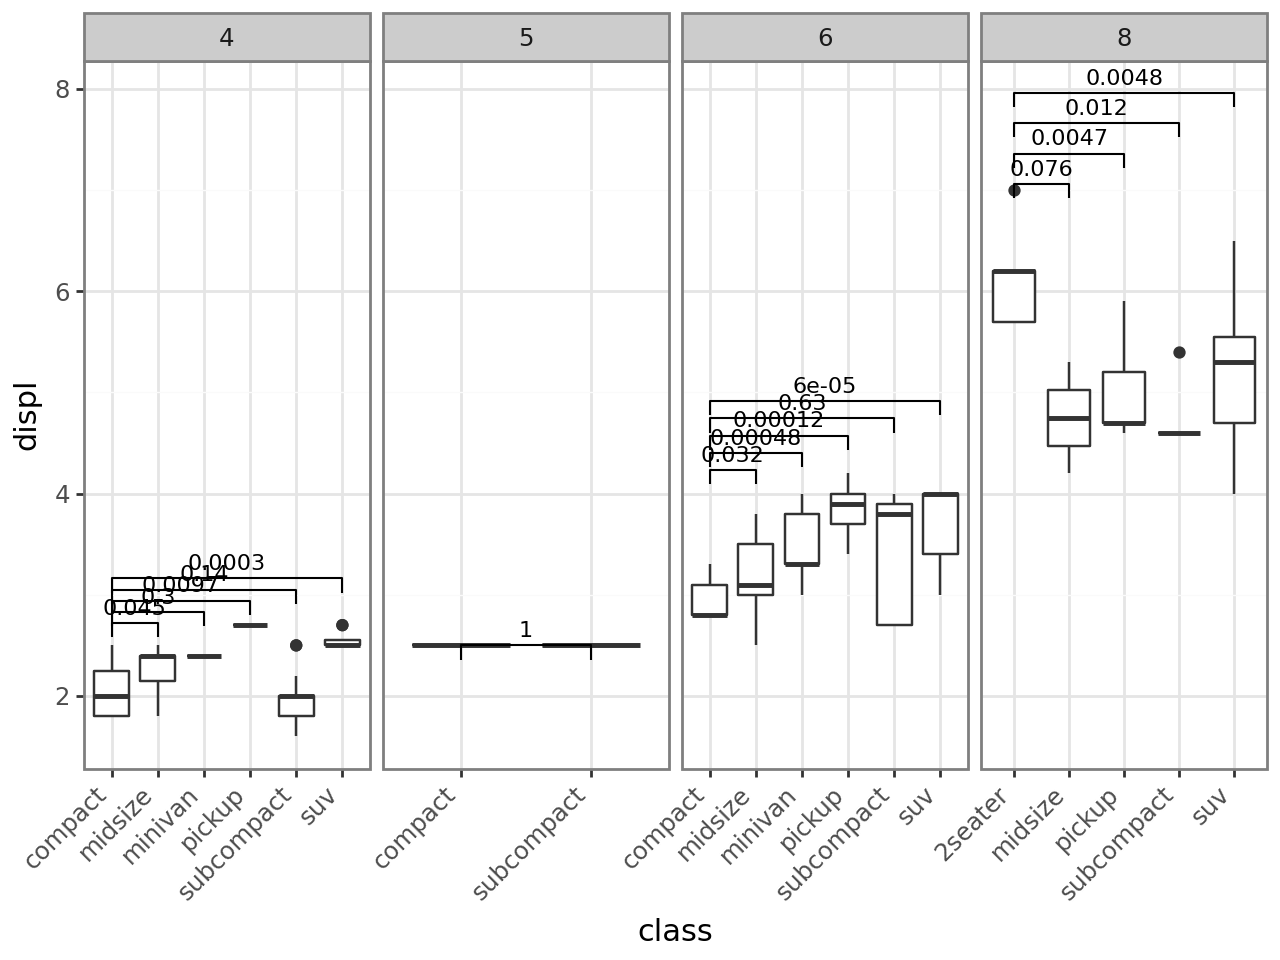
P-value correction
By default, when correction != "none", stat_compare adjusts p-values across the entire layer (including every panel). Set panel_indep=True to fall back on panel-only adjustment, the way ggpubr does.
[13]:
base = (
    ggplot(mpg, aes("class", "displ"))
    + geom_boxplot()
    + facet_grid(cols="cyl", scales="free")
    + theme_bw()
    + theme(axis_text_x=element_text(rotation=45, ha="right"))
)
base
[13]:
Layer-level FDR correction
[14]:
base + stat_compare(ref_group=1, correction="fdr")
[14]:

Panel-level FDR correction
[15]:
base + stat_compare(
    ref_group=1, correction="fdr", panel_indep=True
)
[15]:
Notes on the Python port
The default
geomisgeom_bracket(already shipped withplotnine_extra).For ggcompare’s
arrow=parameter we instead exposebracket=Falseto suppress the bracket and draw only the label. Arrow rendering on the bracket tips is left for a future release.correctionaccepts the same names as R’sp.adjust.methods:none,bonferroni,holm,hochberg,hommel,BH/fdr,BY.methodaccepts a callable returning a scipyHypothesisResult-like object (anything with a.pvalueattribute), so you can plug in custom tests.Horizontal layouts should be made with
coord_flip()after computing the comparison on a discrete x-axis. Directly mapping a continuous variable toxand a discrete grouping variable toyis rejected so that encoded categorical values are not tested silently.